


by James M. Klas
Once again, the NIGC announced its annual revenue figures for Indian gaming for the prior year. While the industry continues to grow, the pace has slowed somewhat. Indian gaming captured $41.9 billion dollars in gaming win in 2023, up 2.4 percent from 2022. After the rollercoaster ride of 2020 and 2021, the industry has resumed its longer-term pace of steady, moderate growth and annual records.
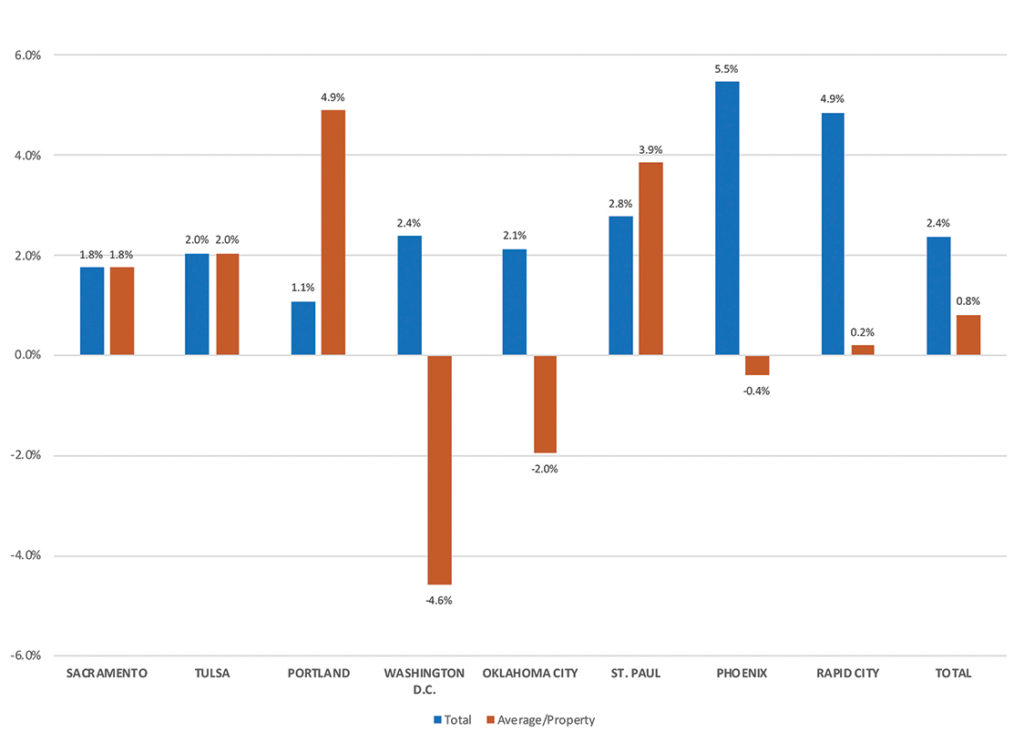
For the second year in a row, the Phoenix region showed the greatest percentage growth at 5.5 percent, followed by the Rapid City region at 4.9 percent. In terms of actual dollars, the D.C. region had the highest growth, increasing by nearly $214.7 million from last year, followed by the Sacramento region at approximately $206.3 million and then Phoenix. Every region saw an increase from 2022. The lowest growth on a percentage basis occurred in the Portland region at only 1.1 percent, with the Sacramento region, despite the total dollar figures, showing a 1.8 percent year-over-year increase. The Rapid City region had the least actual dollar growth despite its percentage increase due to its smaller industry size relative to the other regions. Portland had the next lowest dollar increase year-over-year. Growth in the two Oklahoma regions was also relatively modest on a total dollars basis.
The NIGC received audited financial statements for 527 properties for 2023, an increase of eight properties from 2022. Regions with increased properties reporting included D.C. (+3), Oklahoma City (+3), Phoenix (+3), and Rapid City (+2). Two regions had fewer properties reporting, Portland (-2) and St. Paul (-1). The other regions had the same number of properties reporting as last year.
Taking into account the changes in the numbers of properties reporting, year-to-year average gaming win per property by region presents a more mixed picture than the overall increases region-wide described above. The D.C. region, despite a stronger increase in total dollars and an average increase in overall percentage terms, showed a fairly significant decline in average revenue per property of 4.6 percent from last year, indicating the regional growth came from new additions and partly at the expense of existing operations. The Oklahoma City region and the Phoenix region also showed declines in average gaming win per property, with supply growth outpacing revenue growth. On a revenue per property basis, the Portland and St. Paul regions showed the greatest increases. Nationwide, the growth in average gaming win per property was only 0.8 percent. Figure 1 shows the percentage changes in total gaming revenue and average per property by region from 2022 to 2023.
FIGURE 1: REVENUE CHANGE BY REGION
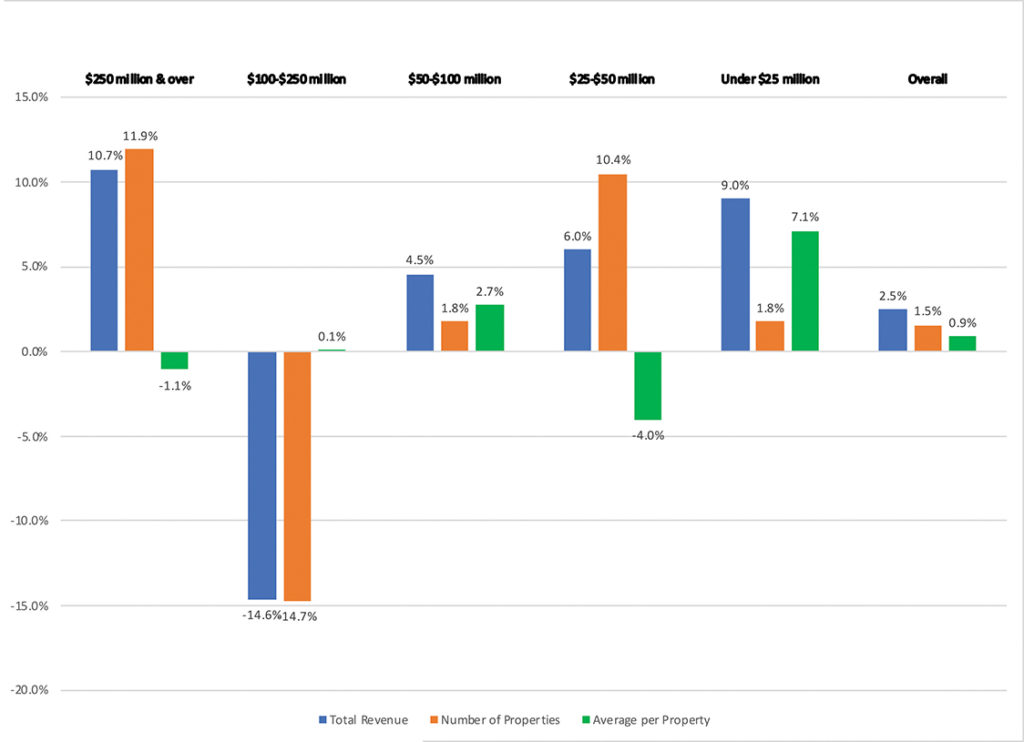
The NIGC also provides information on industry-wide performance by gaming revenue bracket. The top revenue bracket, $250 million or more, showed an increase of 10.7 percent in total gaming revenue over 2022. However, the average per property for the bracket was down 1.1 percent. The next bracket down, $100-$250 million, had a significant decline in total gaming revenue of 14.6 percent, but an average per property that remained virtually un- changed. The reason for the inconsistencies in the top two categories is a movement of some of the best performing properties in 2022 in the $100 to $250 million bracket over the $250 million threshold in 2023 and into the higher bracket. This resulted in the loss of some of the strongest properties in the lower bracket and an increase in the number of properties at the lower end of the higher bracket. Indeed, the $100 to $250 million bracket was the only one to lose properties, going from 68 in 2022 to 58 in 2023. Every other bracket above and below showed increases. Effectively, the newest entrants into the industry tended to be lower tier, most likely satellite facilities, while the properties already open tended to do somewhat better than the prior year in general, causing some to move into the next bracket up. The only two brackets that experienced declines in average revenue per property for their bracket had the highest growth in terms of number of properties reporting for that bracket. The growth occurred from the bottom up. Figure 2 shows year-over-year changes by gaming revenue tier.
FIGURE 2: CHANGE IN TOTAL REVENUE, NUMBER OF PROPERTIES AND AVERAGE/PROPERTY BY REVENUE
For the third year in a row, the U.S. economy is facing the possibility of some form of recession, probably mild and short, and it may never come. The previous two years, the economy continued to show more resilience and prices remained stubbornly on an upward track, preventing rate cuts by the Federal Reserve, but postponing any recession. For the third year in a row, there is a very real possibility that we will once again dodge the bullet and perhaps even get the soft landing that everyone craves. It appears more certain now that the Fed will cut rates multiple times over the next 18 months. The only thing open to debate is how much and how fast rates will be cut and how effective that will be. As this will likely be less and slower, rather than more and faster, the risk of sliding into recession is somewhat higher, therefore a slower and cautious approach is warranted.
For planning purposes for the remainder of this year and looking ahead into 2025, the industry as a whole should maintain a slow to modest growth pattern, comparable to last year, plus or minus half a percentage point. For individual properties, local competitive and economic factors will continue to outweigh national and global impacts. The only caveat is the potential for civil unrest after the upcoming election, whichever side is declared the winner. Major problems are by no means guaranteed and would need to be widespread and sustained to affect the industry. If, however, enough civil angst attaches to the election outcome, a side effect could be a softening of demand around New Year’s Eve, which would be detrimental to year-end figures and start 2025 off poorly. Even if that happens, the effects on the industry would not be expected to last beyond December of this year and the first quarter of next. Overall, 2024 and 2025 are expected to show similar growth patterns to last year.
James M. Klas is Co-Founder and Principal of KlasRobinson Q.E.D., a national consulting firm specializing in the economic impact and feasibility of casinos, hotels and other related ancillary developments in Indian Country. He can be reached by calling (800) 475-8140 or email [email protected].